AAMToolbox viewing statistical model: Difference between revisions
Jump to navigation
Jump to search
No edit summary |
No edit summary |
||
| (2 intermediate revisions by the same user not shown) | |||
| Line 2: | Line 2: | ||
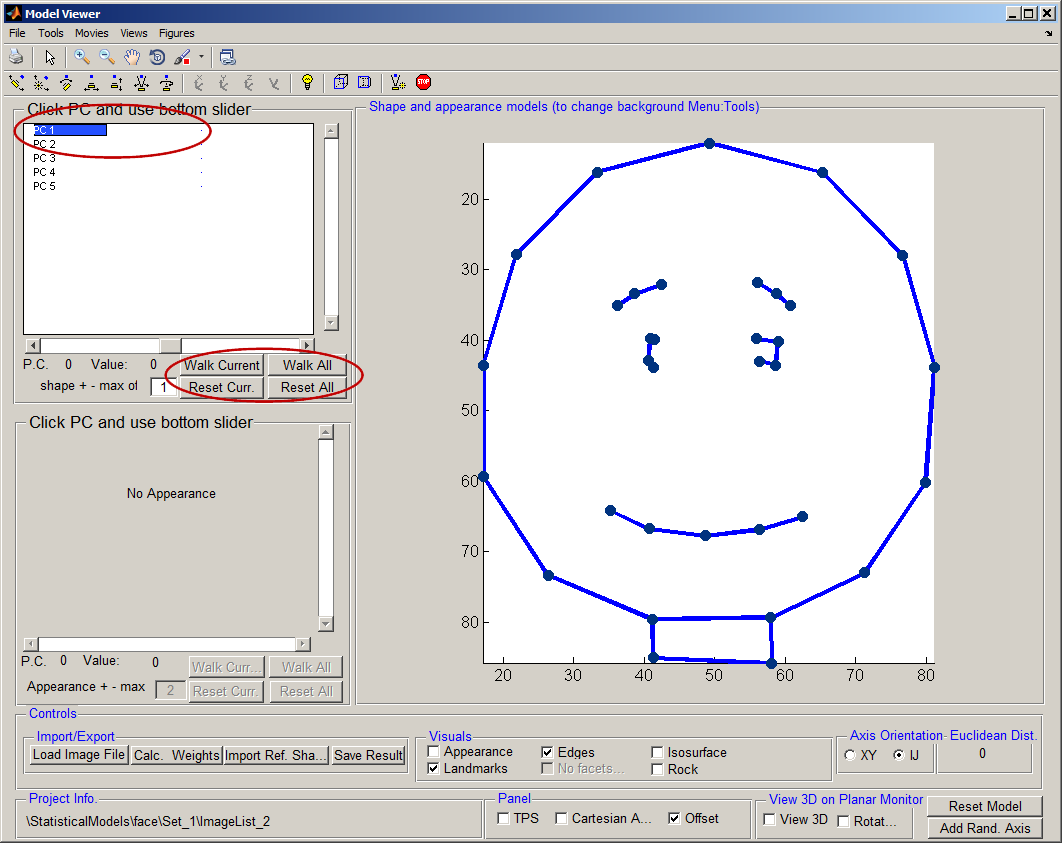
=<span style="color:Navy;">Viewing shape and appearance models in 2D</span>= | =<span style="color:Navy;">Viewing shape and appearance models in 2D</span>= | ||
=<span style="color:Navy;">Walking through contributions of principle | =<span style="color:Navy;">Walking through contributions of principle components.</span>= | ||
<br><br> | <br><br> | ||
[[File:Walk_model_AAMToolbox.png|700px|Model Viewer]]<br><br> | [[File:Walk_model_AAMToolbox.png|700px|Model Viewer]]<br><br> | ||
| Line 15: | Line 15: | ||
|- valign="top" | |- valign="top" | ||
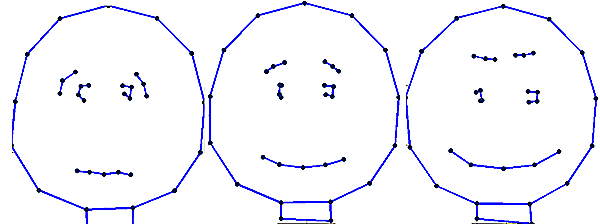
|width="700pt"|To visualise sliding (walking) along an axis imagine a straight line fitted to a set of data points. Then read-out the x,y coordinates as we move back and forth along the line. Correlation between x and y (the straight line) means that the outputs are correlated. In this model we are doing a similar thing as we slide along the axis (fitted line) we read-out values in the model coordinate system that are then transformed (by the model) back into the viewing coordinates. <br><br>[[File:PC1_cartoon_combined.png|200px|The Model generator control panel]]<br> Left, minus one standard deviation along PC1.<br>Middle, mean shape. <br>Right, plus one standard deviation along PC1. | |width="700pt"|To visualise sliding (walking) along an axis imagine a straight line fitted to a set of data points. Then read-out the x,y coordinates as we move back and forth along the line. Correlation between x and y (the straight line) means that the outputs are correlated. In this model we are doing a similar thing as we slide along the axis (fitted line) we read-out values in the model coordinate system that are then transformed (by the model) back into the viewing coordinates. <br><br>[[File:PC1_cartoon_combined.png|200px|The Model generator control panel]]<br> Left, minus one standard deviation along PC1.<br>Middle, mean shape. <br>Right, plus one standard deviation along PC1. | ||
|width="300pt"|<wikiflv width="300" height="300" logo="false" loop="true" background="white"> | |width="300pt"|<wikiflv width="300" height="300" logo="false" loop="true" background="white">CartoonPC1.flv|CartoonPC1.png</wikiflv><br>Sliding (walking) along the principle component axis. | ||
|} | |} | ||
===<span style="color:FireBrick;">Variations along | ===<span style="color:FireBrick;">Variations along axis with the next largest variation</span>=== | ||
{| border="0" cellpadding="5" cellspacing="3" | {| border="0" cellpadding="5" cellspacing="3" | ||
|- valign="top" | |- valign="top" | ||
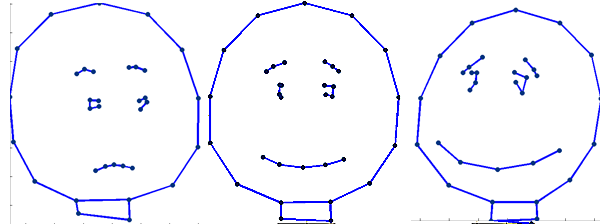
|width="700pt"|<br><br>[[File: | |width="700pt"|<br><br>[[File:PC1_cartoon_combined2.png|200px|+1 and -1 standard deviation from the mean]]<br> Left, minus one standard deviation along PC2.<br>Middle, mean shape. <br>Right, plus one standard deviation along PC2. | ||
|width="300pt"|<wikiflv width="300" height="300" logo="false" loop="true" background="white">CartoonPC2.flv|CartoonPC2.png</wikiflv><br>Sliding (walking) along the axis accounting for the second most amount of variation. | |||
|width="300pt"|<wikiflv width="300" height="300" logo="false" loop="true" background="white"> | |||
|} | |} | ||


