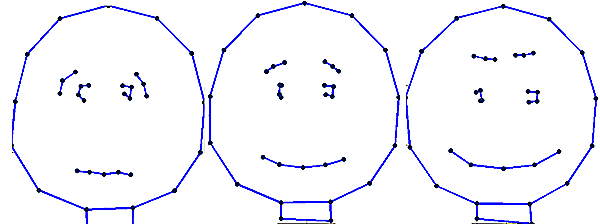
To visualise sliding (walking) along an axis imagine a straight line fitted to a set of data points. Then read-out the x,y coordinates as we move back and forth along the line. Correlation between x and y (the straight line) means that the outputs are correlated. In this model we are doing a similar thing as we slide along the axis (fitted line) we read-out values in the model coordinate system that are then transformed (by the model) back into the viewing coordinates.

Left, minus one standard deviation along PC1.
Middle, mean shape.
Right, plus one standard deviation along PC1.
|
<wikiflv width="300" height="300" logo="false" loop="true" background="white">CartoonPC1.flv|CartoonPC1.png</wikiflv>
Sliding (walking) along the principle component axis.
|