AAMToolbox simplify point model: Difference between revisions
No edit summary |
No edit summary |
||
| Line 1: | Line 1: | ||
[[Tutorials on the Shape modelling toolbox#1|Back to Tutorial pages]]<br> | [[Tutorials on the Shape modelling toolbox#1|Back to Tutorial pages]]<br> | ||
==<span style="color:Navy;">'''What does it mean''' to best fit the shape model to a particular image point model</span>== | ==<span style="color:Navy;">'''What does it mean''' to best fit the shape model to a particular image point model</span>== | ||
All the point models were used to find the shape model. | All the point models were used to find the shape model. If there were just two dimensions, this would be similar to fitting a straight line to ''y=ax'' by finding ''a''. In the Cartoons shape model, there are 34*2=68 dimensions yielding 68 components. However, most of these represent noise and the Stats Model Generator found that 95% of the variance could be accounted for by just 5 of the components. So we should (actually, might is a better word) be able to represent any of the point models that we used to build the shape model. Here, we project a particular point model into shape space, take the 5 principle components (setting the rest to zero), and project the result back into our normal viewing space. The result should look similar to the point model itself.<br><br> | ||
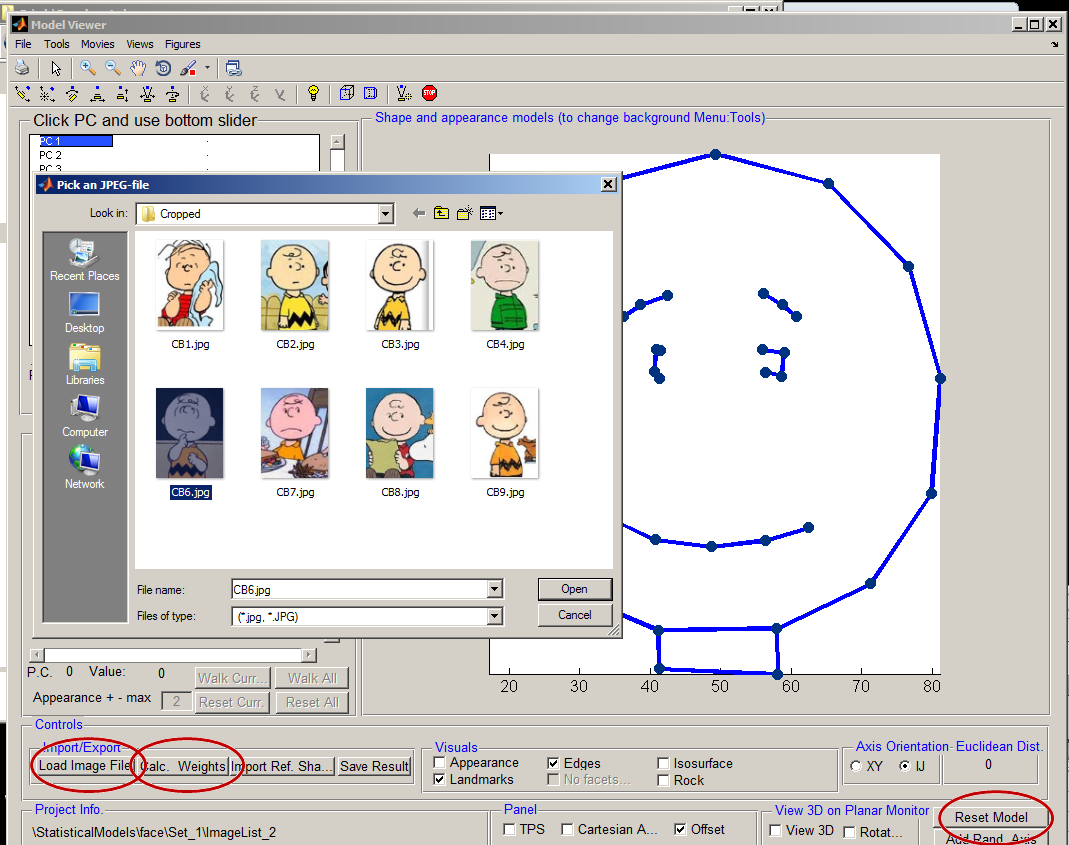
[[File:Loading_point_model_walk_AAMToolbox.png|700px|Loading a point model into ModelViewer]]<br> | [[File:Loading_point_model_walk_AAMToolbox.png|700px|Loading a point model into ModelViewer]]<br> | ||
In the act of loading an image file (highlighted in sub-window). The buttons needed to load an image - actually the point model associated with an image - calculate the associated weights and resetting the model again.<br><br> | In the act of loading an image file (highlighted in sub-window). The buttons needed to load an image - actually the point model associated with an image - calculate the associated weights and resetting the model again.<br><br> | ||
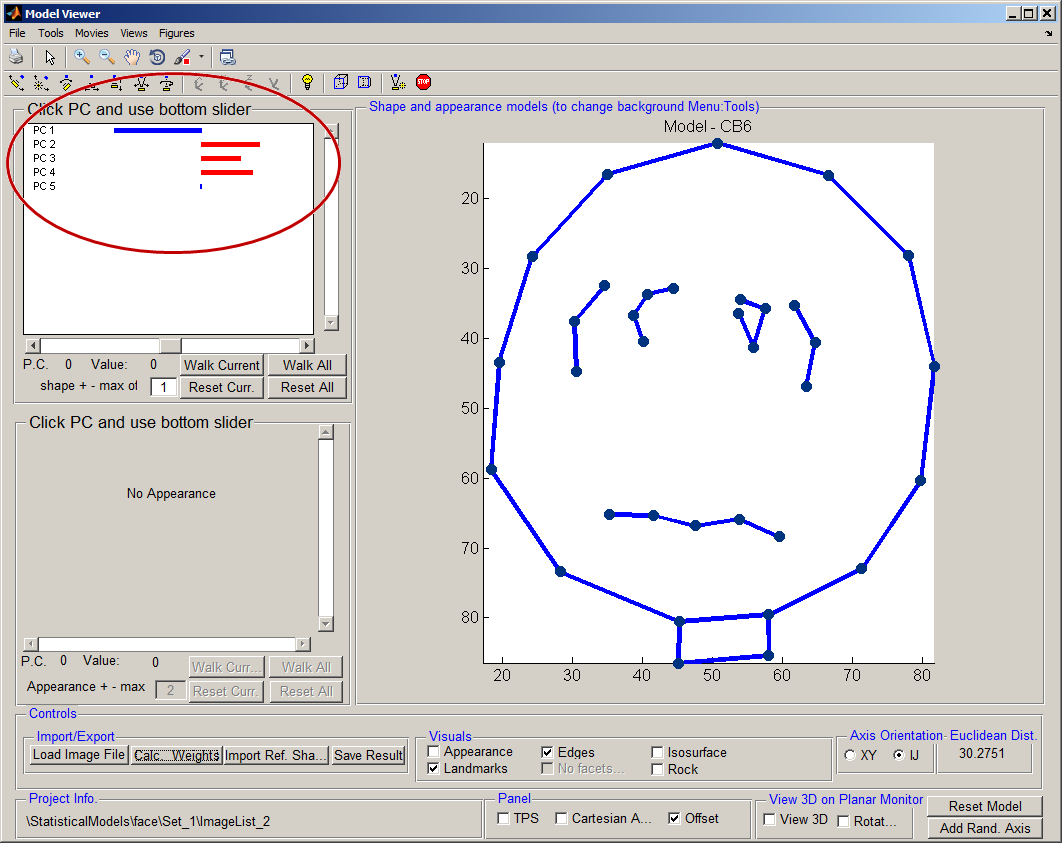
[[File:Deviations_of_a_particular_point_model_AAMToolbox.png|700px|Point model in ModelViewer]]<br> | [[File:Deviations_of_a_particular_point_model_AAMToolbox.png|700px|Point model in ModelViewer]]<br> | ||
Result of Calculating the Weights (see button) . Notice that <br><br> | Result of Calculating the Weights (see button) . Notice that <br><br> | ||
Revision as of 19:30, 20 February 2012
What does it mean to best fit the shape model to a particular image point model
All the point models were used to find the shape model. If there were just two dimensions, this would be similar to fitting a straight line to y=ax by finding a. In the Cartoons shape model, there are 34*2=68 dimensions yielding 68 components. However, most of these represent noise and the Stats Model Generator found that 95% of the variance could be accounted for by just 5 of the components. So we should (actually, might is a better word) be able to represent any of the point models that we used to build the shape model. Here, we project a particular point model into shape space, take the 5 principle components (setting the rest to zero), and project the result back into our normal viewing space. The result should look similar to the point model itself.

In the act of loading an image file (highlighted in sub-window). The buttons needed to load an image - actually the point model associated with an image - calculate the associated weights and resetting the model again.

Result of Calculating the Weights (see button) . Notice that