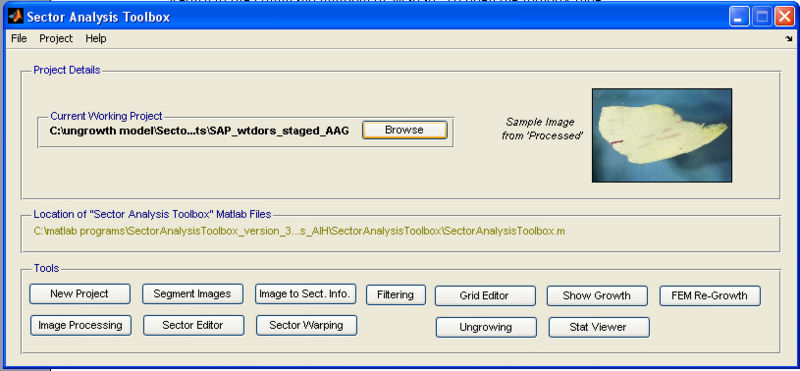
SectorAnalysisToolbox Details
What? How? Where?

What? We wish to understand how patterns of gene activity in biological organs influence the developing shape. The shapes arise because different regions of, for example a sheet of cells, grow at different rates. The problem is that a particular shape outline could arise through a number of different patterns of growth inside the outline. To solve the problem, therefore, it is necessary to observe and measure growth rates of the growing organ. With small organs growth can be tracked at the cell scale using confocal microscopy. As the organ gets larger, this becomes impractical and we use an alternative: clonal analysis.
Clones of cells arise from divisions of a single cell. It becomes useful if the cell (and its daughters) are marked in some way. The mark could be the shape of hairs in a fly wing, or the colour of cells in a flower petal. As result of multiple cell divisions, growth, the shape of the clone (sometimes call the sector) changes. The Sector Analysis Toolbox (SAT) is used to quantify patterns of growth by analysing the shapes of these sectors or clones.
How? The Sector Analysis Toolbox is coded in Matlab and a valid Matlab licence is required to use it.
Where? The toolbox is available for download here.
Requirements: MATLAB.