Details on hydrophobicity plots
MSER_and_Sieve_Details#ApplicationsBack to MSERs etc

Abstract from ...
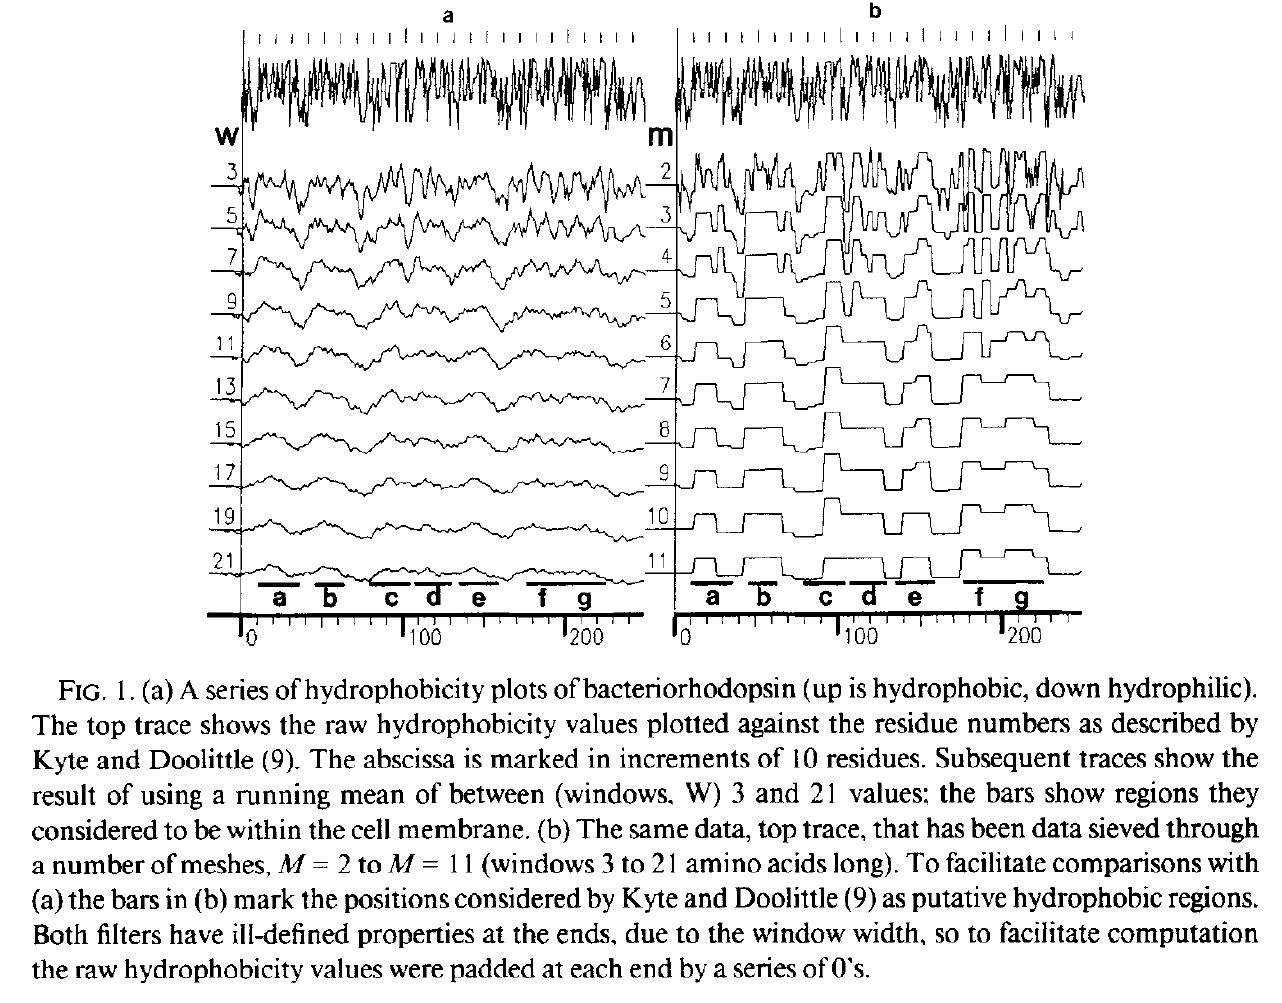
Bangham, J.A. (1988) Data-sieving hydrophobicity plots. Anal. Biochem. 174, 142–145
Hydrophobicity plots provide clues to the tertiary structure of proteins (J. Kyte and R. F. Doolittle, 1982, J. Mol. Biol.157, 105; C. Chothia, 1984, Annu. Rev. Biochem.53, 537; T. P. Hopp and K. R. Woods, 1982, Proc. Natl. Acad. Sci. USA78, 3824). To render domains more visible, the raw data are usually smoothed using a running mean of between 5 and 19 amino acids. This type of smoothing still incorporates two disadvantages. First, peculiar residues that do not share the properties of most of the amino acids in the domain may prevent its identification. Second, as a low-pass frequency filter the running mean smoothes sudden transitions from one domain, or phase, to another. Data-sieving is described here as an alternative method for identifying domains within amino acid sequences. The data-sieve is based on a running median and is characterized by a single parameter, the mesh size, which controls its resolution. It is a technique that could be applied to other series data and, in multidimensions, to images in the same way as a median filter.
Actually, for the data-sieve I did use a cascade of medians which was a very inefficient algorithm. Subsequently, I switched to a cascade of 1D recursive medians which also preserved scale space but was hugely quicker and is idempotent.
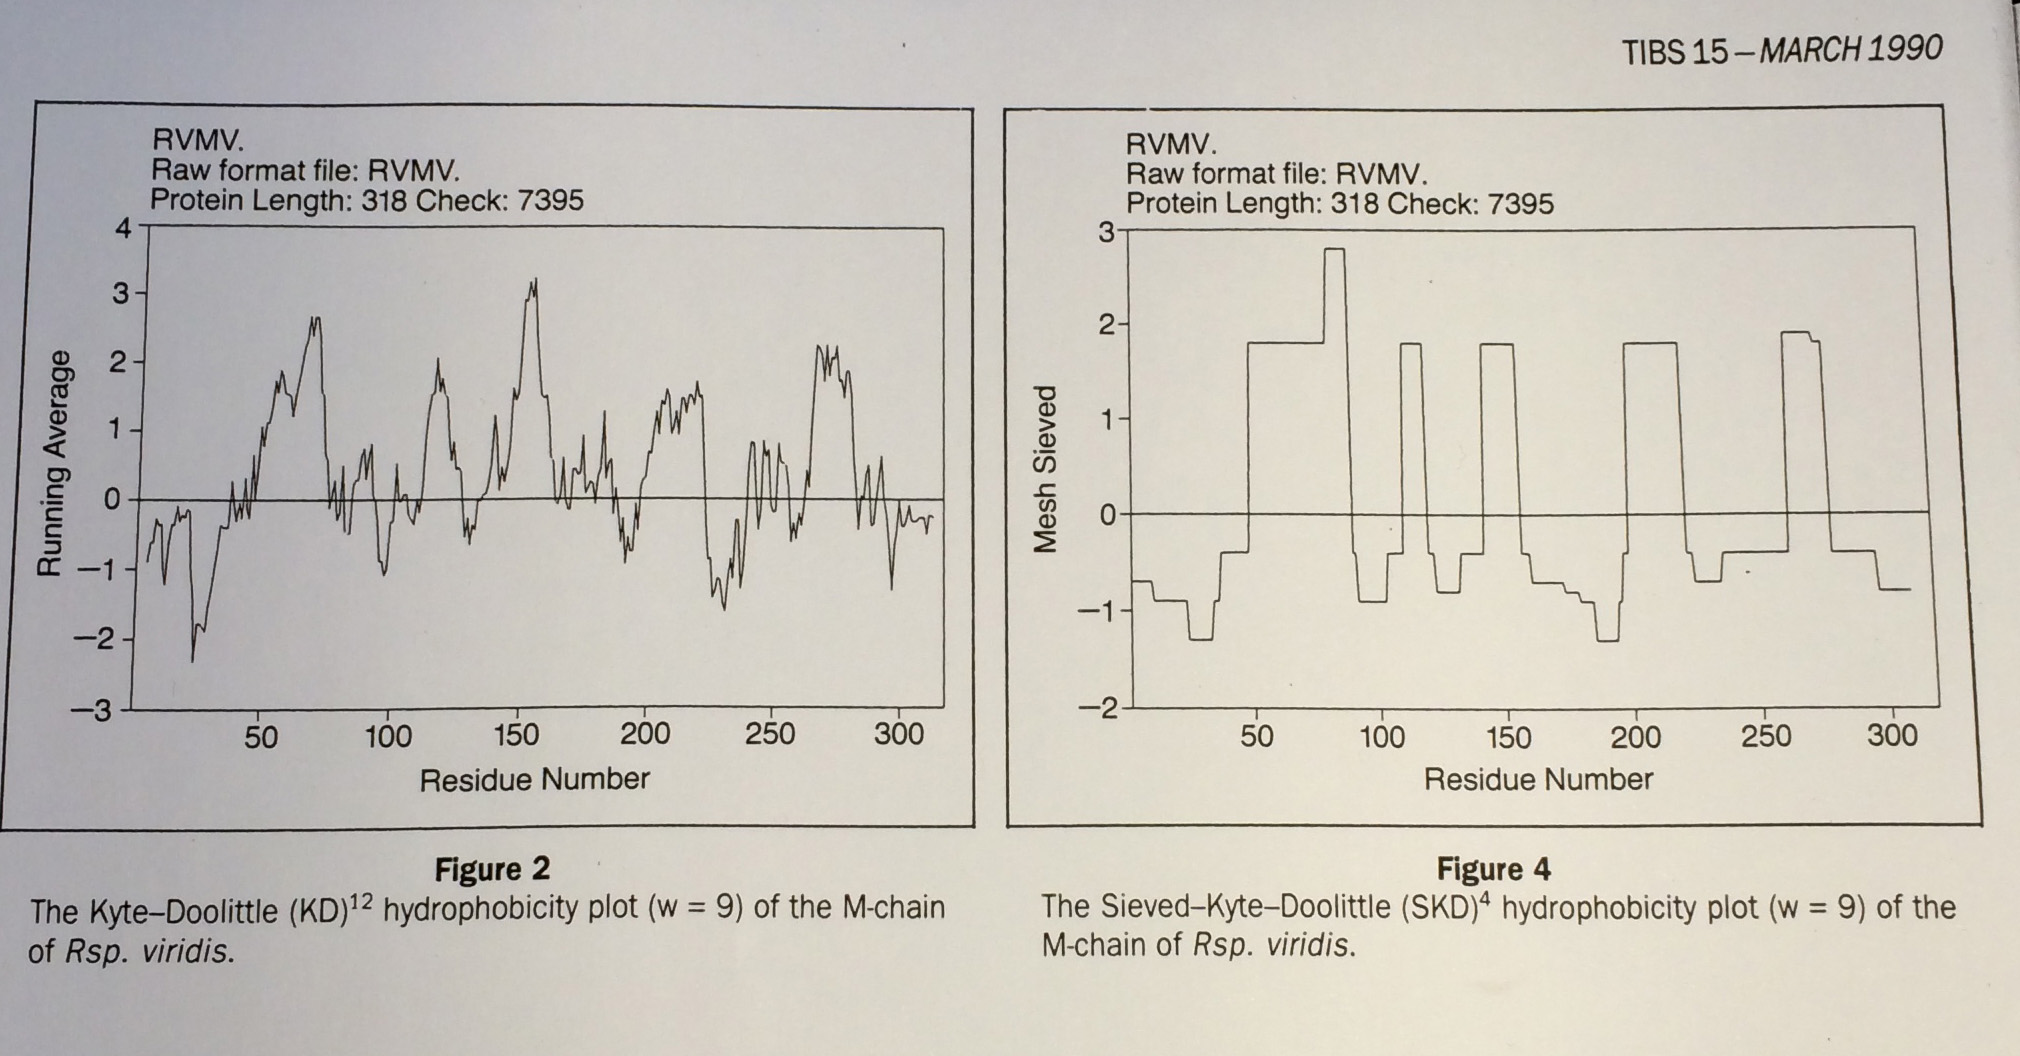
 From Fasman and Gilbert "The prediction of transmembrane protein sequences and their conformation: an evaluation" in Trends in Biochemistry 15 pp 89:91