Revision as of 18:36, 14 April 2012
Return to Bangham Lab Software
Current Status
MTtbox is currently under test and further development
The main data structure is called: 'data'. It can be accessed from the Matlab command line by declaring data to be global.
global data
at any time. The following documentation will refer to fields in data. It also refers to the custom menu items by menu:name.
Graphical User Interface
1 A
The toolbox is launched with the command
MTtbox
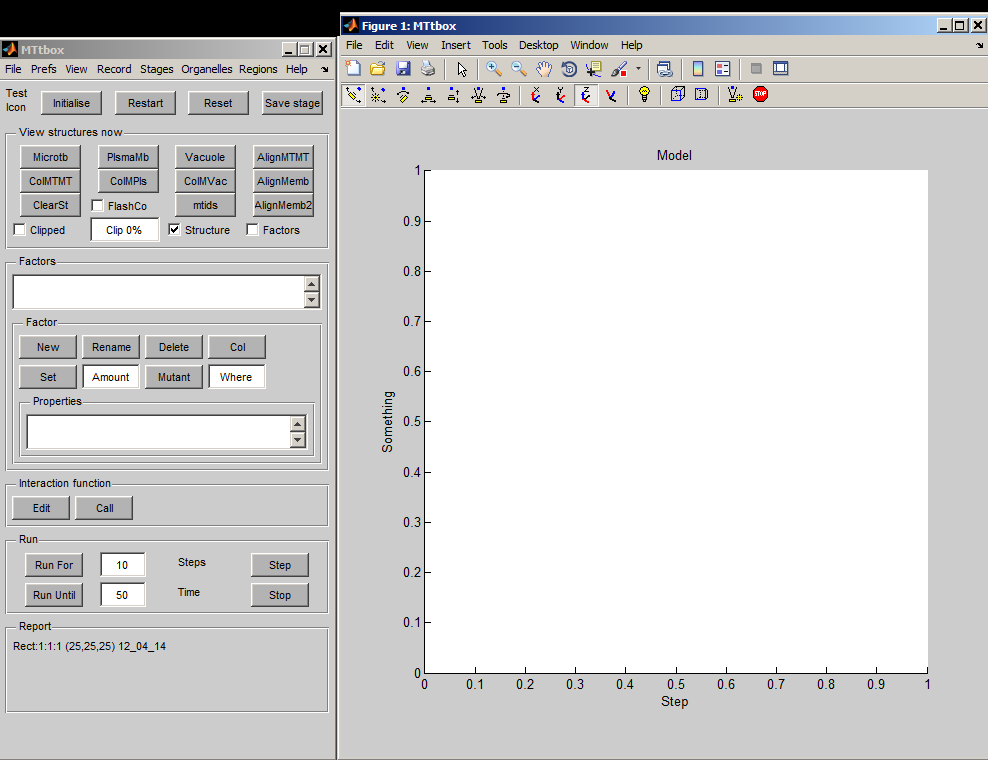
Which will cause the interface to appear at the top left of the monitor.
The left panel (accessed through the handle: data.PanelH) provides control and the right panel (data.plotprops.AxesH) displays the output. They can be dragged anywhere and returned to the top-left using menu:View:Controls to top-left.
|

|
1 B
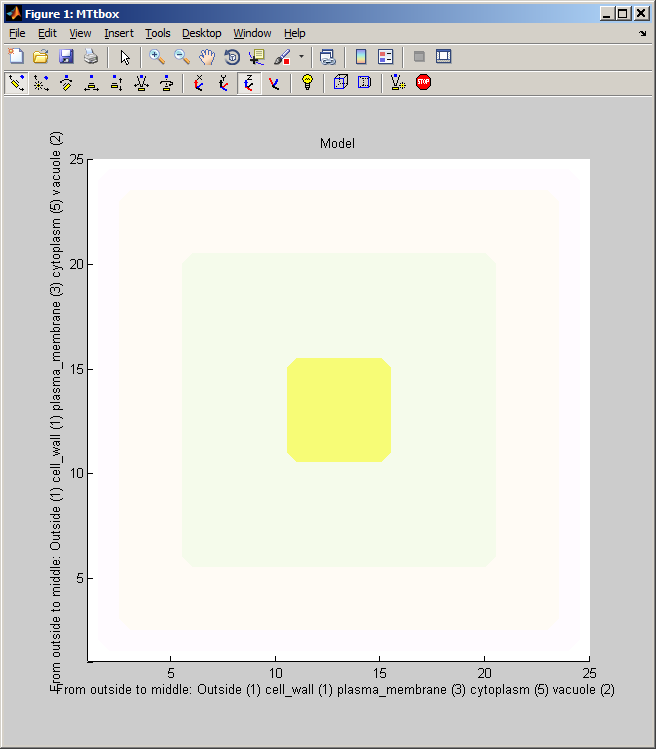
A default project is created by selecting: menu:File:New Project
It forms a cell bounded by regions labelled: Outside, cell_wall, plasma_membrane, cytoplasm and vacuole. These are concentric volumes. Length is measured in microns (time in seconds). The axis labels indicate the thickness of each layer in terms of voxels in this particular model. This is extremely low resolution - it means that the microtubules will have to be unrealistically large. This is convenient for debugging and illustrating the system but not for simulations. The outer surface of each region is coloured, e.g. the vacuole is yellow and the cytoplasm is green.
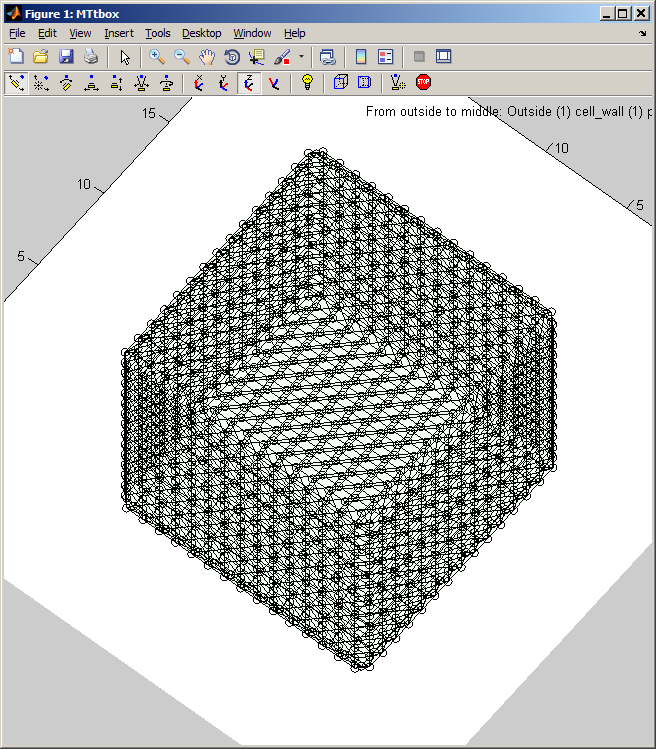
The cell can be rotated etc. using the panels at the top of the display panel. Here all the regions have been hidden (uncheck each item in menu:View) and the mesh associated with the cytoplasm outer surface is displayed (check menu:View:Organelle meshes)

|

|


