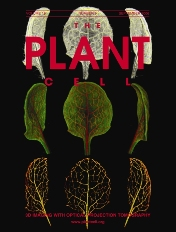
"Visualising Plant Development and Gene Expression in 3D using Optical Projection Tomography": Difference between revisions
No edit summary |
|||
| Line 18: | Line 18: | ||
[http://cmpdartsvr1.cmp.uea.ac.uk/downloads/software/QtVolViewerLITEv1.zip QtVolViewerLITEv1.zip] | [http://cmpdartsvr1.cmp.uea.ac.uk/downloads/software/QtVolViewerLITEv1QuickStart.pdf QuickStart.pdf] | [http://cmpdartsvr1.cmp.uea.ac.uk/downloads/software/QtVolViewerLITEv1UserManual.pdf UserManual.pdf] | [http://cmpdartsvr1.cmp.uea.ac.uk/downloads/software/QtVolViewerLITEv1.zip QtVolViewerLITEv1.zip] | [http://cmpdartsvr1.cmp.uea.ac.uk/downloads/software/QtVolViewerLITEv1QuickStart.pdf QuickStart.pdf] | [http://cmpdartsvr1.cmp.uea.ac.uk/downloads/software/QtVolViewerLITEv1UserManual.pdf UserManual.pdf] | ||
===QtVolViewer v1.64=== | |||
Latest public version of QtVolViewer. Only tested on the following hardware: Nvidia 7900GTX & Nvidia 8800GTX. | |||
[http://cmpdartsvr1.cmp.uea.ac.uk/downloads/software/QtVolViewerLITEv1.zip QtVolviewerV1.64.zip] | |||
=Acknowledgements= | =Acknowledgements= | ||
Revision as of 17:10, 10 July 2008

Manuscript
"Visualising Plant Development and Gene Expression in 3D using Optical Projection Tomography", K. Lee, J. Avondo, H. Morrison, L. Blot, M. Stark, J. Sharpe, J. A. Bangham, and E. S. Coen
Sumplementary Material
Datasets used in Figures
Optical Projection Tomograpy dataset, for figures 1 and 2. [1]
Software
QtVolViewerLITE v1
The QtVolViewLITE program is designed to run on any PC with a 64 Mbyte graphic card. It is suitable for viewing the data shown in Figures 1A and 2A as colour OPT volume and section views of the Antirrhinum flower. Internal floral structures such as anther lobes and the ovary at the base of the carpel are revealed. Three OPT scan channels are visible. Transmission (shown in blue), endogenous fluorescence, Leica TXR filter (shown in red) and GFP fluorescence, GFP1 filter (shown in green).
QtVolViewerLITEv1.zip | QuickStart.pdf | UserManual.pdf
QtVolViewer v1.64
Latest public version of QtVolViewer. Only tested on the following hardware: Nvidia 7900GTX & Nvidia 8800GTX.
Acknowledgements
BBSRC for grant support, JIC/UEA/MRC and MRC Technology.
Software team
Jerome Avondo with help from Lilian Blot and the Bangham group in the Computational Biology Group, Computing Sciences, University of East Anglia, Norwich,