Software
Current activity: a collaboration with the CoenLab with the aim of understanding how patterns of gene activity in biological organs influence the developing shape. The BanghamLab is focussed on the conceptual underpinning: concepts captured in computational growth models, experimental data visualisation and analysis.
Notes on documenting our software
Notes for Lab members on how to contribute to this Wiki and where to put downloads.
Computational biology
Quantitative understanding of growing shapes: GFtbox
Work with GFtbox to practice thinking quantitatively about the relationship between genes, growth and form.
| Example of a growing snapdragon flower ( Green et al 2011). Growth is specified by factors (genes) according to the Growing Polarised Tissue Framework. | Journal.pbio.1000537.g009.png</wikiflv> |
| <imgicon>GPT_thumbnail2.png|120px|GFtbox</imgicon> |
For modelling the growth of shapes. Ready Reference Manual
What? How? Where? Background Download GFTbox from SourceForge Petals Sauret-Güeto et al 2013 |
GFtbox is an implementation of the Growing Polarised Tissue Framework for understanding and modelling the relationship between gene activity and the growth of shapes such leaves, flowers and animal embryos (Kennaway et al 2011). The GPT-framework was used to capture an understanding of (to model) the growing petal (Sauret-Güeto et al 2013), leaf (Kuchen et al 2012) and Snapdragon flower Green et al 2011. The Snapdragon model was validated by comparing the results with other mutant and transgenic flowers Cui et al 2010. Key is how outgrowths can be specified by genes. The icon shows an asymmetrical outgrowth. Conceptually, it is specifed by two independent patterns under genetic control: a pattern of growth and a pattern of organisers. The outgrowth arises from a region of extra overall growth. Growth is aligned along axes set by two interacting systems. Organisers at the ends of the mesh create a lengthwise gradient. This gradient interacts with the second due to an organiser that generates polariser in a region that becomes the tip of the outgrowth. (Kennaway et al 2011) |
Viewing and measuring volume images: VolViewer
| <imgicon>VolViewer-logo.png|120px|VolViewer</imgicon> | For viewing and measuring volume images on both normal and stereo screens. Typical images from: confocal microscope and Optical Projection Tomography (OPT) images What? How? Where? Cell: Online Gallery | Front cover: Handbook of Plant Science | Front cover: The Plant Cell | American Scientist | Royal Microscopical Society: Infocus Magazine | Bundled with the Bioptonic 3001 scanner: Bioptonics Viewer | The Daily Mail | The Guardian newspaper: 3D Fruit fly | Qt Ambassador program | Triffid Nurseries website
|
VolViewer is used as a stand-alone app. or as a viewport for other systems, e.g. Matlab programs. VolViewer uses OpenGL and Qt to provide a user friendly application to interactively explore and quantify multi-dimensional biological images. It has been successfully used in our lab to explore and quantify confocal microscopy and optical projection tomography images. It is open-source and is also compatible with the Open Microscopy Environment (OME). |
Analysing shapes in 2D and 3D: AAMToolbox
| <imgicon>AAMToolbox_logo.jpg|120px|AAMToolbox</imgicon> | For analysing populations of shapes and colours within the shapes using principal component analysis. What? How? Where?
|
The AAMToolbox enables the user analyse the shape and colour of collections of similar objects. Originally developed to analyse face shapes for lipreading (Matthews et al. 2002version of pdf), we have used it extensively for analysing the shapes of leaves (Langlade et al 2005.,Bensmihen et al. 2010) and petals (Whibley et al 2006,Feng et al. 2010). The analysis can be applied to art, for example, finding systematic differences between portraits by Rembrandt and Modigliani. |
Analysing the shapes of clones: SectorAnalysisToolbox
| <imgicon>Sector analysis icon.jpg|120px|SectorAnalysisToolbox</imgicon> | For analysing the shapes of marked cell clones. What? How? Where? |
The SectorAnalysisToolbox enables the user analyse the shapes of marked clones in a sheet of tissue. |
Algorithms
MSERs, extrema, connected-set filters and sieves
The algorithm finding MSER's starts with a connected-set opening or 'o' sieve
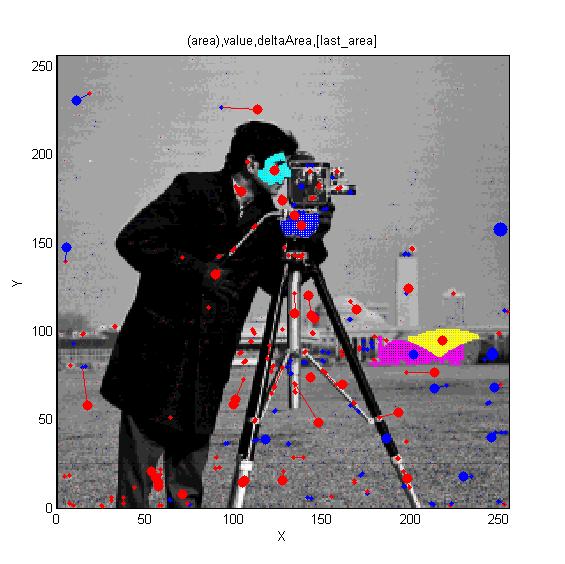 Cameraman image. Superimposed red spots are maximal extrema and blue spots are minima. Irregular cyan, blue and yellow regions illustrate regions associated with maxima and the magenta region is a minimum. Cameraman image. Superimposed red spots are maximal extrema and blue spots are minima. Irregular cyan, blue and yellow regions illustrate regions associated with maxima and the magenta region is a minimum.
|
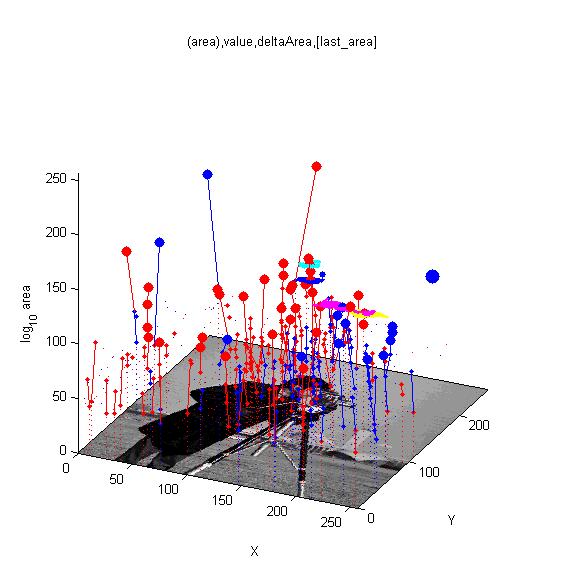 Isometric view of the cameraman image with superimposed maxima (red) and minima (blue). The trees trace the maxima through increasing scale-space. Large spots have been identified as stable extrema. |
For finding features in and segmenting images.
What? How? Where?
Tutorials: from the beginning
Art, extrema of light and shade: PhotoArtMaster
Art created using ArtMaster was featured in an exhibit at the London Victoria and Albert (V&A) Museum exhibition '???' exhibition finding its name.
 
|
The sieve algorithms underpinning PhotoArtMaster software
(an extract of the
'essay ). These documents were written to support our Fo2Pix company. A Windows version of the software will soon be downloadable from here for free (originally it sold >65,000 licences but Fo2Pix had to be closed primarily due to ill health.)

|
Reaction-diffusion and morphogenesis
|
|

Illustration of morphogenesis inspired by Turing's paper.
Example using growth toolbox GPT_ReactionDiffusionTentacles_20121211.zip
1 A
| A simple reaction-diffusion system develops a pattern of spots.
|
<wikiflv width="300" height="300" logo="false" loop="true" background="white">GPT_rd_rk_tentacles_20120417-0004.flv|GPT_rd_rk_tentacles_20120417-0004_First.png</wikiflv> |
| Two simple growth rules translate the pattern into directed growth. The changing geometry that arises through growth causes the reaction-diffusion patterning to continue to change.
|
<wikiflv width="300" height="300" logo="false" loop="true" background="white">GPT_rd_rk_tentacles_20120417-0001.flv|GPT_rd_rk_tentacles_20120417-0004.png</wikiflv> |
Open source systems to which we contribute
OMERO
| <imgicon>OMERO_DIAGRAM.jpg|100px|OMERO</imgicon> | For working with the OME image database. See Details, Download OMERO Workshop (Windows, Mac, Linux) |
Open Microscopy Environment Remote Objects (OMERO). for visualising, managing, and annotating scientific image data. See also our OMERO Workshop training course we ran in April 2011. |
Tools and Utilities
BioformatsConverter
| <imgicon>BioformatsConverterZip.png|100px|BioformatsConverter</imgicon> | For converting microscope manufacturer proprietary file formats. See Details (Windows, Mac, Linux) |
This tool allows for the batch conversion of microscope manufacturer proprietary file formats, to the open source OME-TIFF standard. Uses the Bioformats library. |
In development
MTtbox
| <imgicon>MTtboxA.jpg|100px|BioformatsConverter</imgicon> | For modelling the behaviour of microtubules within a cell. See Details |
In development. The idea is to be able to model the behaviour of growing microtubules and factors as they react chemically and diffuse within the different cell compartments. The icon shows a spherical cell sliced open to show concentric components: cell wall (magenta), plasma-membrane (yellow), cytoplasm (green) and vacuole (yellow). Microtubules (blue) grow in 3D within the cytoplasm. |