Main Page: Difference between revisions
No edit summary |
No edit summary |
||
| Line 27: | Line 27: | ||
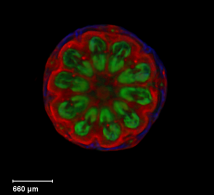
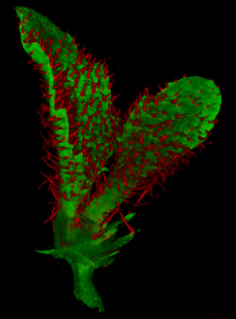
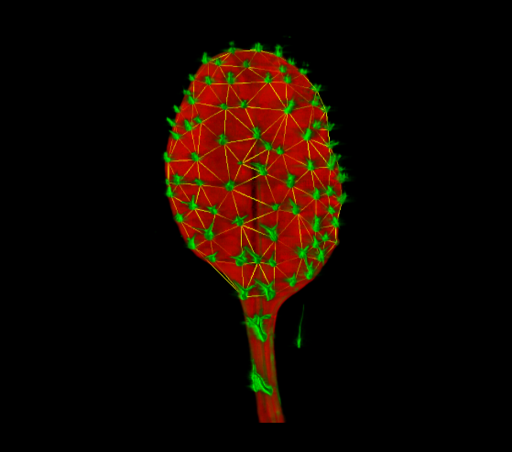
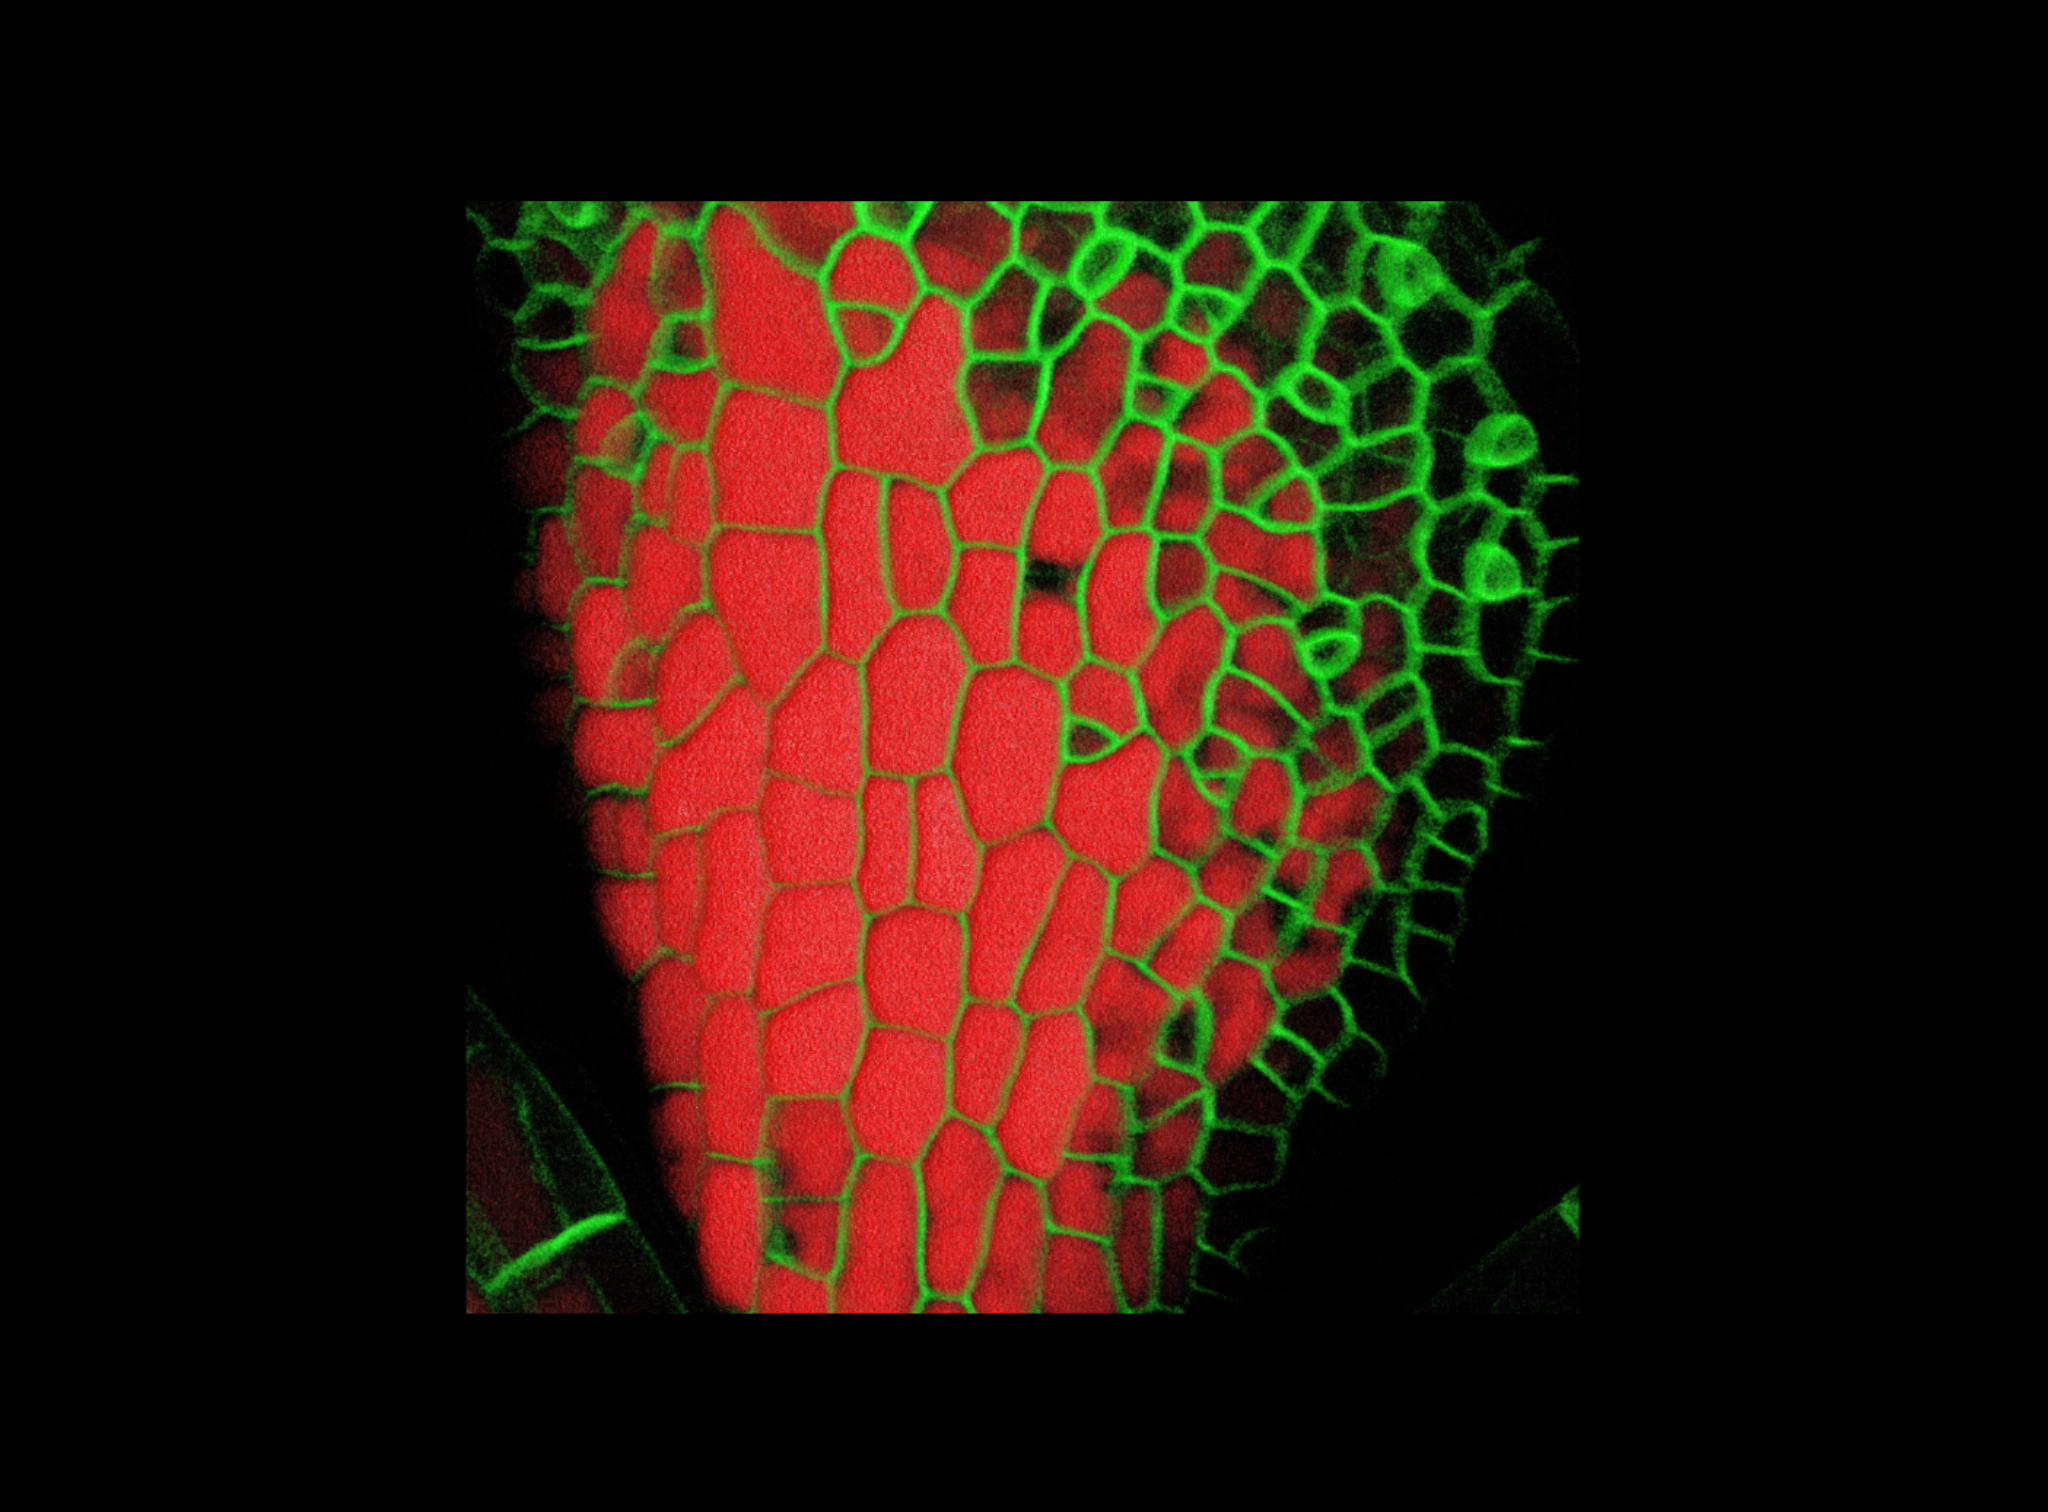
==<span style="color:DarkGreen;">VolViewer== | ==<span style="color:DarkGreen;">VolViewer== | ||
{| border="0" style="background-color:#000000;" | |||
|- | |||
|align="center"| | |||
[[Image:Cs0prxz0.png|128x128px]] | |||
[[Image:GL2_GUS.png|128x128px]] | |||
[[Image:Leaf_trichomes.png|128x128px]] | |||
[[Image:Leaf5.png|128x128px]] | |||
[[Image:LFY_GUS_Arabidopsis_inflorescence_512.png|128x128px]] | |||
[[Image:OleosinSeed.png|128x128px]] | |||
|} | |||
{| border="0" cellpadding="5" cellspacing="5" | {| border="0" cellpadding="5" cellspacing="5" | ||
|- valign="top" | |- valign="top" | ||
Revision as of 10:29, 6 March 2012
Bangham Lab - Home
Current activity: a collaboration with the CoenLab with the aim of understanding how patterns of gene activity in biological organs influence the developing shape. The BanghamLab is focussed on the conceptual underpinning: concepts captured in computational growth models, experimental data visualisation and analysis.
Computational biology toolboxes
GFtbox
| <imgicon>GPT_thumbnail2.png|120px|GFtbox</imgicon> |
For modelling the growth of shapes. Download GFTbox from SourceForge Ready Reference Manual |
GFtbox is an implementation of the Growing Polarised Tissue Framework for understanding and modelling the relationship between gene activity and the growth of shapes such leaves, flowers and animal embryos (Kennaway et al 2011). The GPT-framework was used to capture an understanding of (to model) the growing leaf (Kuchen et al 2012) and Snapdragon flower Green et al 2011. The Snapdragon model was validated by comparing the results with other mutant and transgenic flowers Cui et al 2010. The icon shows an asymmetrical outgrowth. Conceptually, it is specifed by two independent patterns under genetic control: a pattern of growth and a pattern of organisers. The outgrowth arises from a region of extra overall growth. Growth is aligned along axes set by two interacting systems. Organisers at the ends of the mesh create a lengthwise gradient. This gradient interacts with the second due to an organiser that generates polariser in a region that becomes the tip of the outgrowth. (Kennaway et al 2011) |
VolViewer
| <imgicon>VolViewer-logo.png|120px|VolViewer</imgicon> | For viewing and measuring biological images. What? How? Where? |
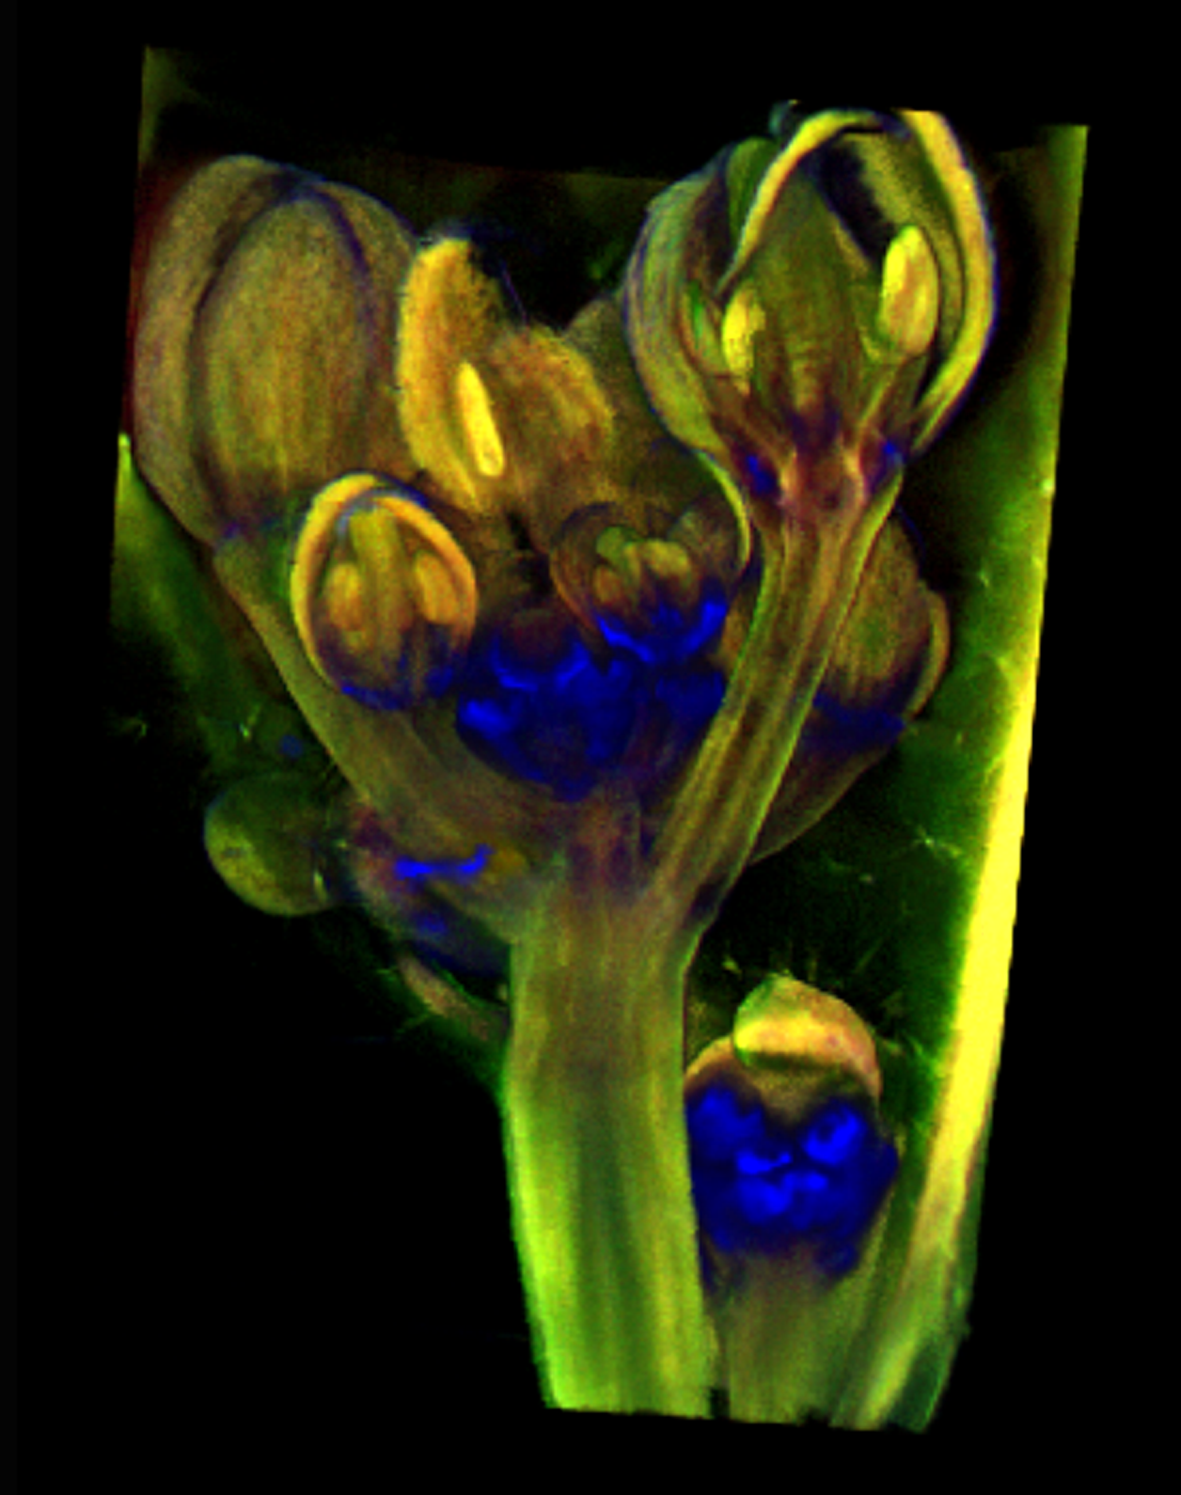
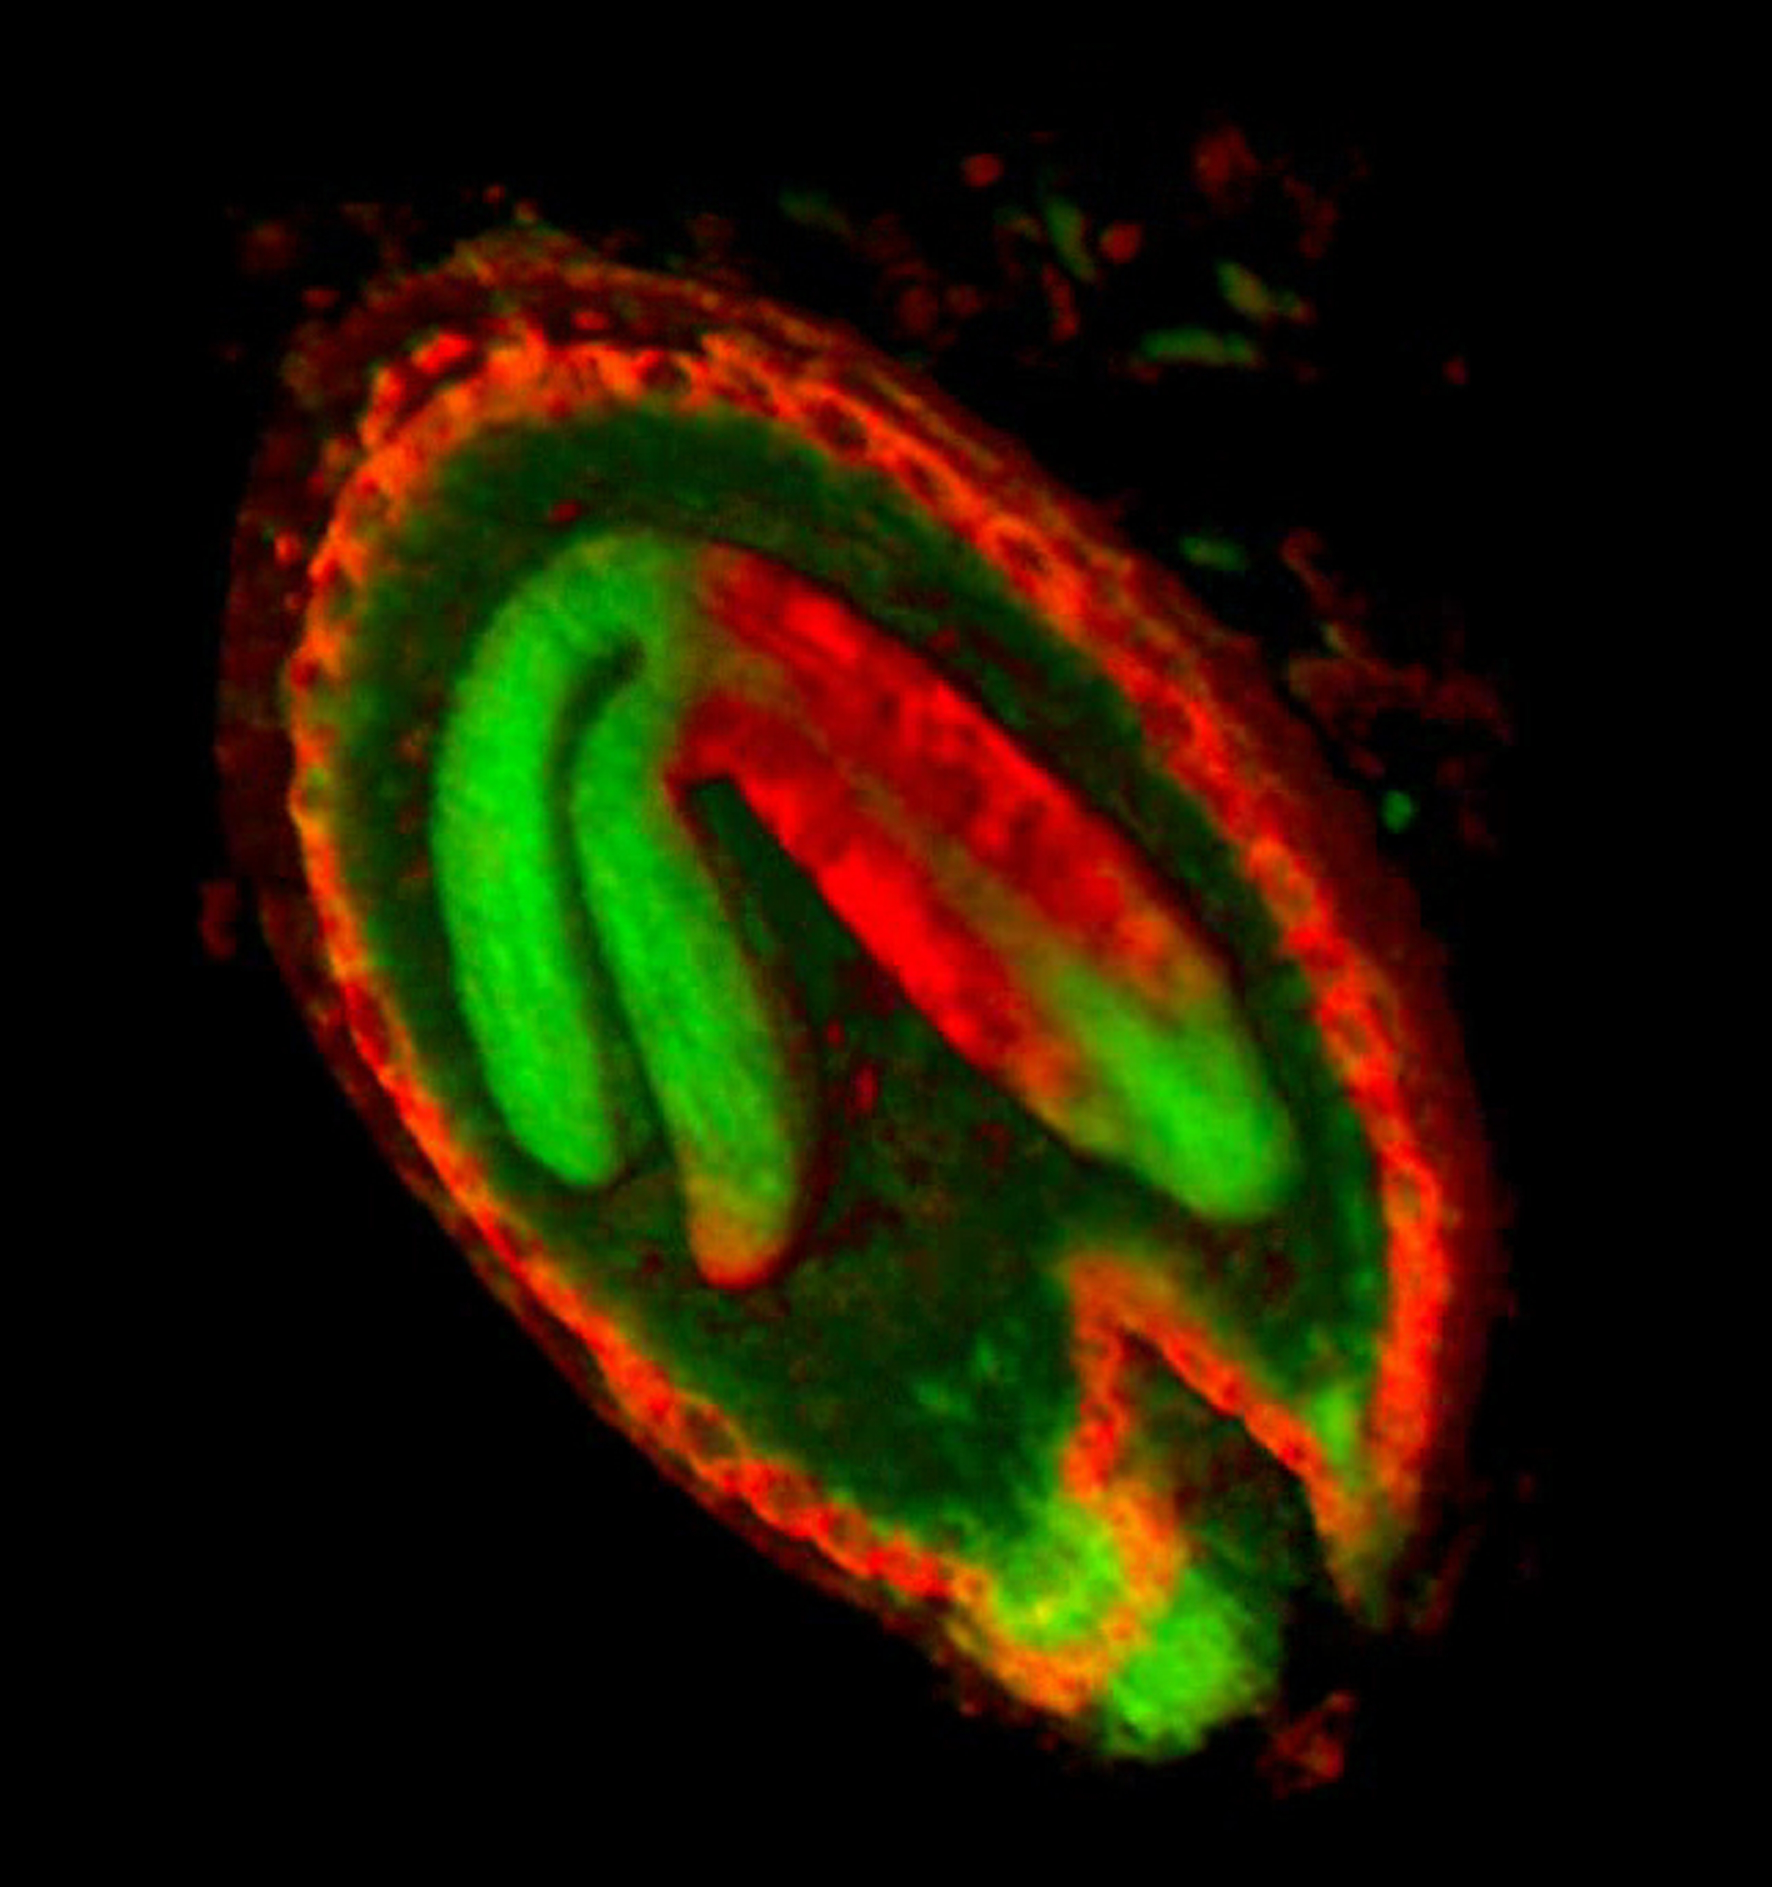
VolViewer uses OpenGL and Qt to provide a user friendly application to interactively explore and quantify multi-dimensional biological images. It has been successfully used in our lab to explore and quantify confocal microscopy and optical projection tomography images. It is open-source and is also compatible with the Open Microscopy Environment (OME). |
AAMToolbox
| <imgicon>AAMToolbox_logo.jpg|120px|AAMToolbox</imgicon> | For analysing populations of shapes and colours within the shapes using principal component analysis. What? How? Where? (PC, Mac, Linux, uses Matlab |
The AAMToolbox enables the user analyse the shape and colour of collections of similar objects. Originally developed to analyse face shapes for lipreading, we have used it extensively for analysing the shapes of leaves and petals. The analysis can be applied to art, for example, finding systematic differences between portraits by, for example, Rembrandt and Modigliani. |
